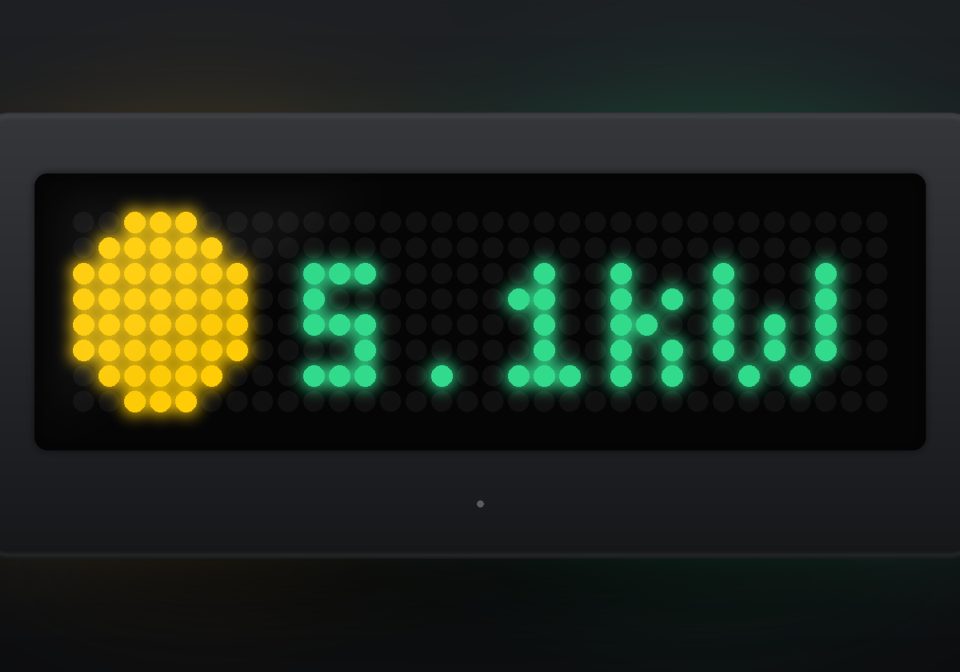
PV Power (SolarEdge Cloud API)
Shows the current PV output of your SolarEdge system in Watts/kW, colour-coded by power level.
| System | AWTRIX NG Scripts |
|---|---|
| Firmware | AWTRIX NG |
| Topic | Smarthome |
| Built by | simpi |
| File | mvrwjjLFw0kN.ax · 2.1 KB |
| Icons | — |
| Published | 5 Aug 2026 · updated 5 Aug 2026 |
| Downloads | 50 |
Shows the current solar production ("PV") of a SolarEdge system on an AWTRIX NG display. Tested with a SolarEdge SE10K-RWB48.
What it shows
- A small sun on the left (drawn directly, no icon file needed)
- Current PV power on the right, in Watts or kW
- Colour-coded by power level: grey (0 W) → orange → yellow → light green → deep green (high power)
- Red status pixel in the bottom-right corner if the last data is older than ~2400 ticks
Data source
Uses the SolarEdge Monitoring API, specifically the currentPowerFlow.json endpoint. It reads the PV field rather than the net value at the grid connection point (overview.currentPower) — this keeps the value accurate even on systems with a battery.
Note: SolarEdge's cloud only refreshes this data every few minutes up to ~15 minutes. The value can lag a bit behind the SolarEdge app — that's a limitation of the public API, not a bug in the script.
Setup
- Log in to the SolarEdge Monitoring Portal
- Admin (gear icon) → Site Access → Access Control → API Access
- Activate API access, copy the key
- Enter your Site ID (found in the portal URL) and API key in the script (
siteId,apiKeyininit())
Required icons
None — the sun is drawn directly as pixels.
Known limitations
- Cloud data can be up to ~15 min old
- Shows PV production only, not consumption or grid draw (would need to also read
LOAD/GRID)
mvrwjjLFw0kN.ax
# @name PV Power
# @desc Current PV output, SolarEdge SE10K-RWB48
# @author simpi
# @version 1.0

class PV
  # Enter Site ID and API key here (SolarEdge Monitoring Portal:
  # Admin -> Site Access -> Access Control -> API Access)
  var siteId, apiKey
  var power, ticks, age

  def init()
    self.siteId = "SITE_ID"
    self.apiKey = "SOLAREDGE API TOKEN"
    self.power = store.get("power")
    self.ticks = 0
    self.age = 9999
  end

  def on_body(w, status)
    if w == nil return end
    # Use the PV field, not the net value (site may have a battery)
    var m = re.search("\"PV\":[^}]*\"currentPower\":([-0-9.]+)", w)
    if m == nil return end
    var kw = num(m[1])
    if kw == nil return end
    self.power = kw * 1000.0
    self.age = 0
    store.set("power", self.power)
  end

  def loop()
    self.age += 1
    if self.ticks <= 0
      self.ticks = 900
      http.get("https://monitoringapi.solaredge.com/site/" + self.siteId +
               "/currentPowerFlow.json?api_key=" + self.apiKey,
               / b, st -> self.on_body(b, st),
               {'find': "\"PV\":", 'keep': 100})
    end
    self.ticks -= 1
  end

  def draw()
    clear()
    if self.power == nil
      text(6, 6, "...", 0x666666)
      return
    end

    var p = self.power
    var label, col

    if p < 1
      label = "0W"
      col = 0x666666
    elif p < 500
      label = str(int(p)) + "W"
      col = 0xFF7A27
    elif p < 3000
      label = str(int(p)) + "W"
      col = 0xFFCC00
    elif p < 5000
      var kw = p / 1000.0
      label = str(int(kw)) + "." + str(int((kw - int(kw)) * 10)) + "kW"
      col = 0xFFFF28
    else
      var kw = p / 1000.0
      label = str(int(kw)) + "." + str(int((kw - int(kw)) * 10)) + "kW"
      col = 0x6ED228
    end

    # small sun on the left, same fallback style as the weather script's icon
    circle_fill(4, 4, 3, 0xFFCC00)

    text(9 + int((22 - text_ink_width(label)) / 2), 7, label, col)

    if self.age > 2400
      pixel(width() - 1, height() - 1, 0xFF0000)
    end
  end

  def on_button(btn)
    if btn == "select" self.ticks = 0 end
  end
end

return PV()
Install it on your AWTRIX NG
Your browser writes the script straight to the device on your network. It joins the app rotation right away.
Some browsers refuse to talk to a device on your network from a public page. Download the flow and paste it into the Scripts tab of your device, or install it from a terminal:
More flows for AWTRIX NG Scripts or Smarthome
Something wrong with this flow? Report it.